People have lesser time to absorb data. We rarely have free time in our day to go through all the blogs we would like to read or dig deeper into the topics we are interested in. There are billions of blogs, white papers, ebooks and other written pieces of content produced every week. Even more for tweets and social media posts which are being shared with opinions. How can an average person catch up with all this?
The answer is infographics. Infographics are becoming more and more popular because they provide summarized information attractively. You can make them very informative and fun which will attract people’s attention immediately. You can add charts, icons, illustrations, graphs, and much more to them and surround them with the data you like to share. There are many reasons to invest more in infographics, but we will focus on the five most important ones.
What is an infographic?
Infographics are a visual representation of information or data. It can be different images, like charts, graphs, illustrations, or other complemented by minimal text. The goal of infographics is to make a specific topic very easy to understand so that you can grab the information quickly.
As you can guess, infographics are very visual, so most people created them based on their style, which makes each of them uniquely different. Usually, the most successful ones are the ones that are eye-catching and that are with an out-of-the-box design. The most common uses of an infographic are:
- Give a quick summary of a topic;
- Explain a complex issue or process in a simple way;
- Present data of research and surveys;surveys
- Summarize long pieces of content;
- Comparison between two options and others.
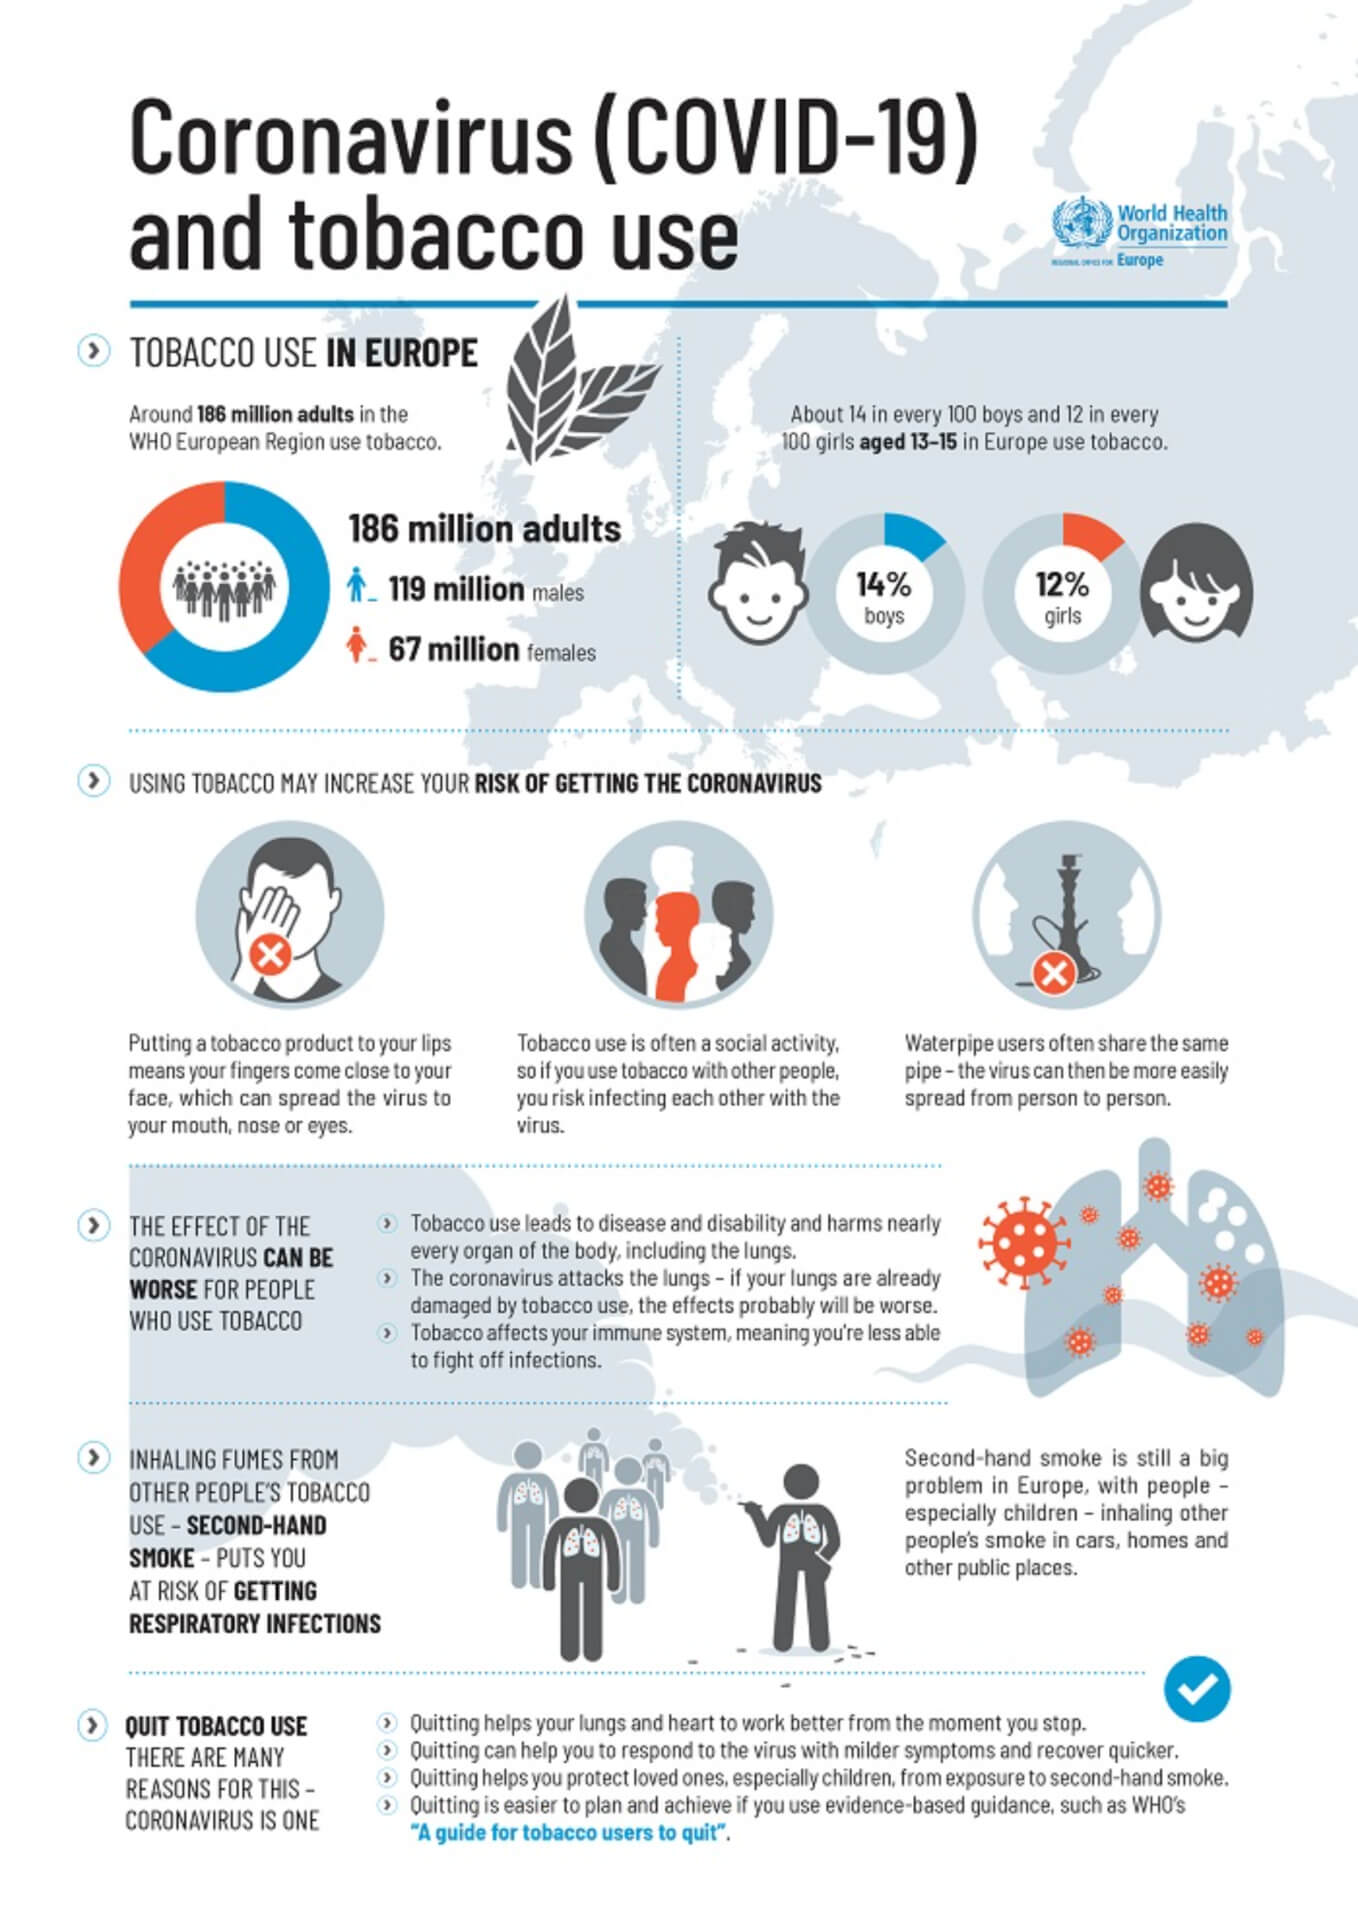
You might have seen many infographics created around the COVID-19 topics like what the virus is and how it is spread, how you should protect yourself, information about the vaccines, or how to perform home tests. Below, you can see one that was created by WHO and is a perfect example of an infographic simply explaining a complex topic:

Five reasons why you should invest in infographics
There are countless reasons to use infographics, but we will focus on the most important ones that can convince you to invest in them to create better content.
Expanding your reach
Infographics are a type of content that can be easily published in different places and not only on your site or blog. Videos or anything else visual is getting more and more popular. Considering how many people are now spending an enormous amount of time on their social media like Instagram, Facebook, Pinterest, Snapchat, and others, not posting content there that can engage with this public is a big miss.
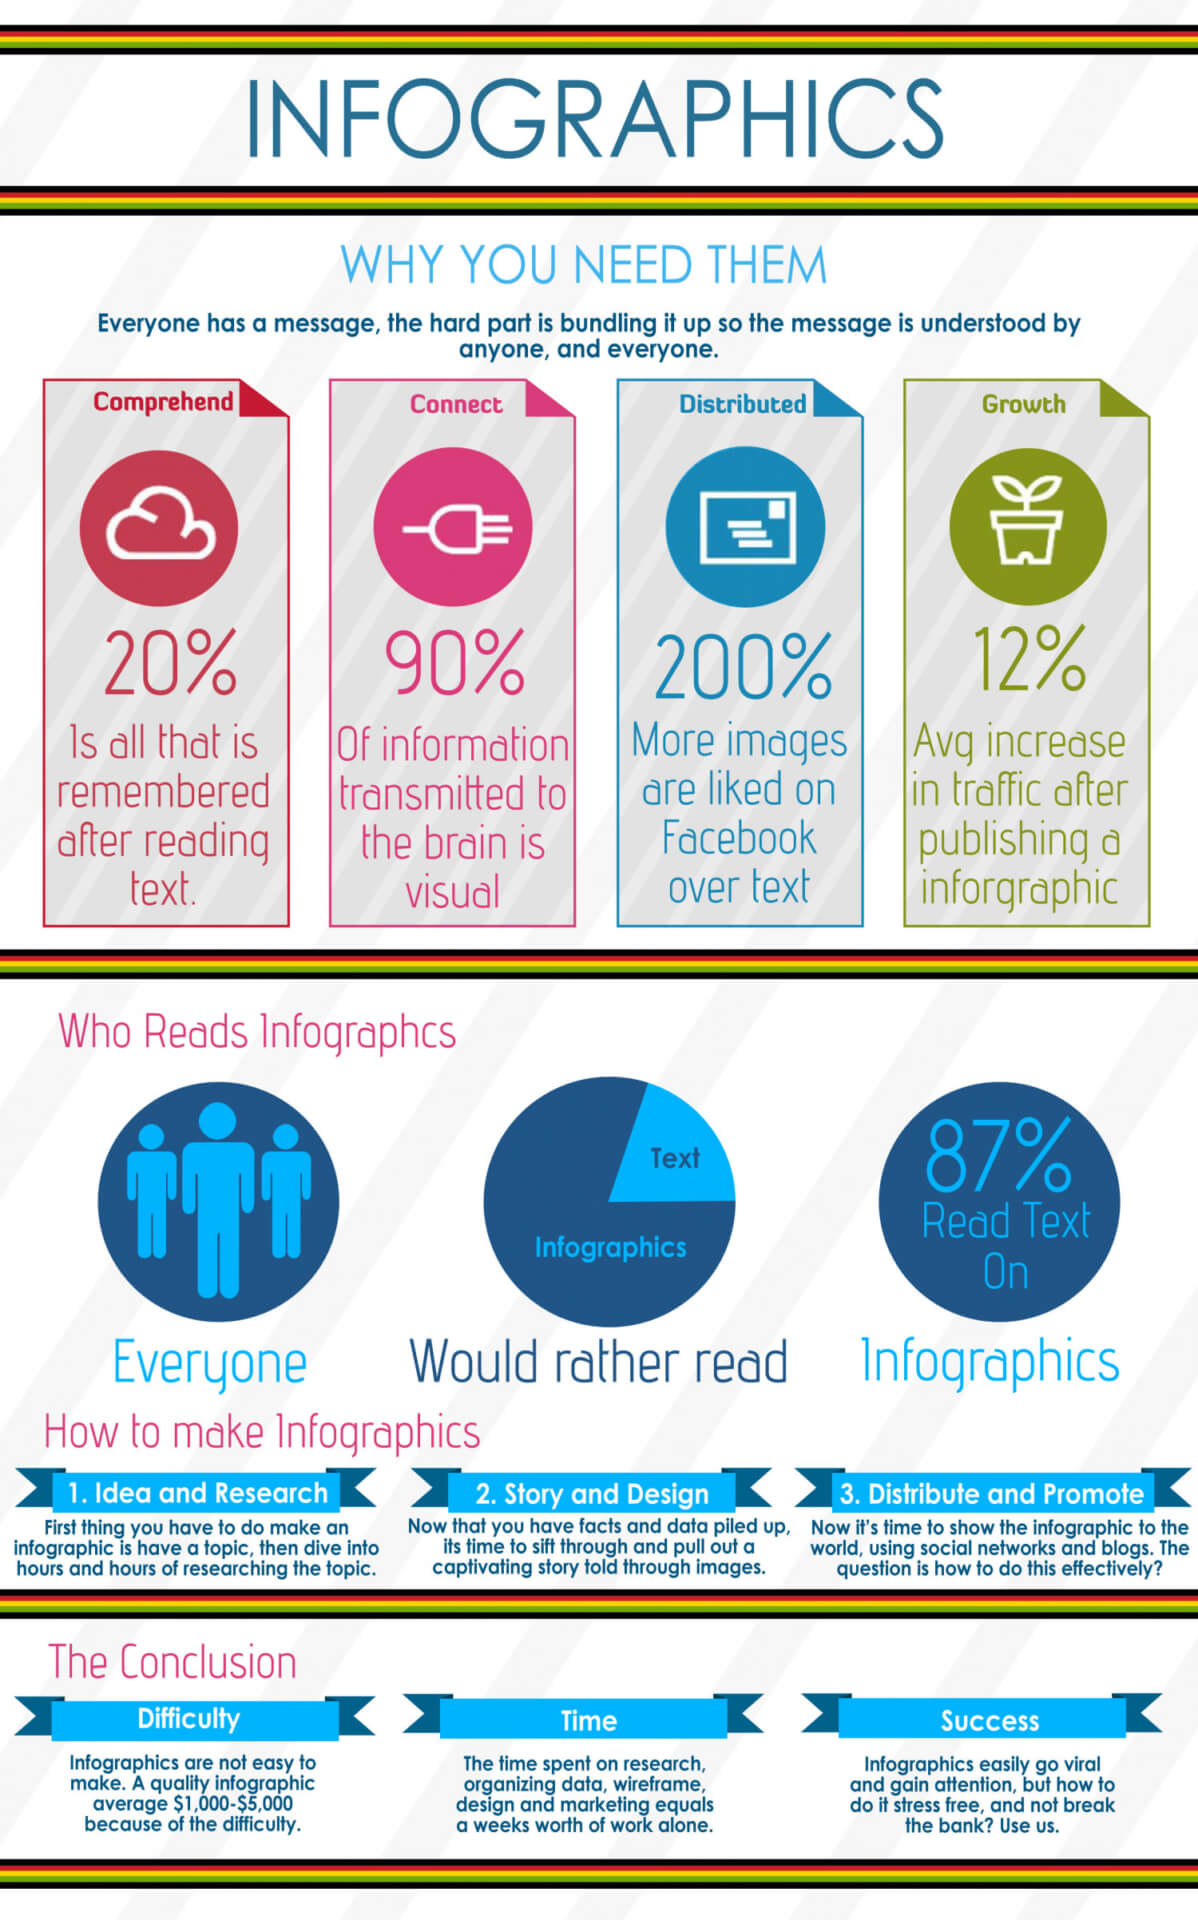
According to many studies, people perceive visuals better than text, which is expected considering 90% of information transmitted to the brain is visual. Therefore, even subconsciously, we would always focus more on a picture or a video compared to a long piece of text.
When we are interested in a certain topic, we would want to have our data displayed in colourful and organised manner. Hence, infographics are the perfect solution for sharing data on different social media platforms and not keeping it only on your blog. If your design is interesting and compliments the data you share, it will attract more people, and those people might reshare it, and then the reach will be even more significant.
Increase brand recognition
Infographics can help you enormously make your brand recognized by the larger public. If you have a very distinguished design that will become recognizable after a couple of infographics, people will already know you and look for more content from you. You don’t have to produce new content all the time because infographics can repurpose and reuse.
Another excellent aspect is that infographics can become viral easily and quickly. As mentioned, this will expand your reach and brand recognition. They will know you as a person sharing helpful information in an easy-to-understand way. So, you will become a valuable source of information for them, and they will visit your site or social media profile to read more of what you produced.
Better high-quality back linking strategy
Not every brand can produce infographics, as they may lack a design team. However, producing infographics can be used for back linking. Back linking is very important for Google and other search engines to determine rankings. Not every backlink has the same impact, so aiming at high-quality ones is everyone’s goal.
Many reputable sites don’t have their own design team or even authors working their full time or are more than willing to accept guest contributions. Such sites and blogs usually welcomed infographics that can share valuable data differently. Reaching out to such sites is a perfect way to share your infographics with a much larger public but also win some high-quality backlinks.
They improve SEO performance
Since we mentioned that back linking to your infographics helps with increasing rankings, we should note that this is not the only way that they help with improving your SEO score. This type of content improves your site traffic, conversion rates, and return on investment. You can use an infographic on your site and social media, email marketing, advertisement, and many other channels. This automatically will mean that your reach will increase, and therefore the metrics will increase as well.
By sharing information that people are interested in but not in the usual way with a long and wordy blog post with many complex terms, you are giving them access to something different that is much easier to grasp. This will turn you into a source of information that people will come back to, and the traffic to your site will increase, and if you will people’s trust, then your conversions will increase and therefore your return on investment as well.
Enhance readability
People have no time to read, and any text-heavy content will easily turn them down, and they will find another source of information. This doesn’t mean that written content is dead. People still love blogs, white papers, ebooks, etc. They also prefer something like infographics which they can look at for 2 minutes and understand a topic. Here are a couple of tips on how to make your infographic easy to understand and very attractive:
- Use attractive colors — Of course, try to stick to your brand colors, but in a combination, you can use some grabbing colors for the illustration or the graphs;
- Come up with a generic template — This will save you a lot of time if you decide to produce infographics regularly. Having a generic template that you can just reuse and change whenever needed will improve your job efficiency and will also make your style easily recognizable;
- Don’t overdo it — Don’t add too much information to your infographic. Try to keep it simple and summarize only the most essential data.
And what better way to finish this blog than an infographic on why you need infographics?


